Monitor every signal
Stay ahead of the events that reshape your strategic environment.
Politics
Economics
Regulations
Markets
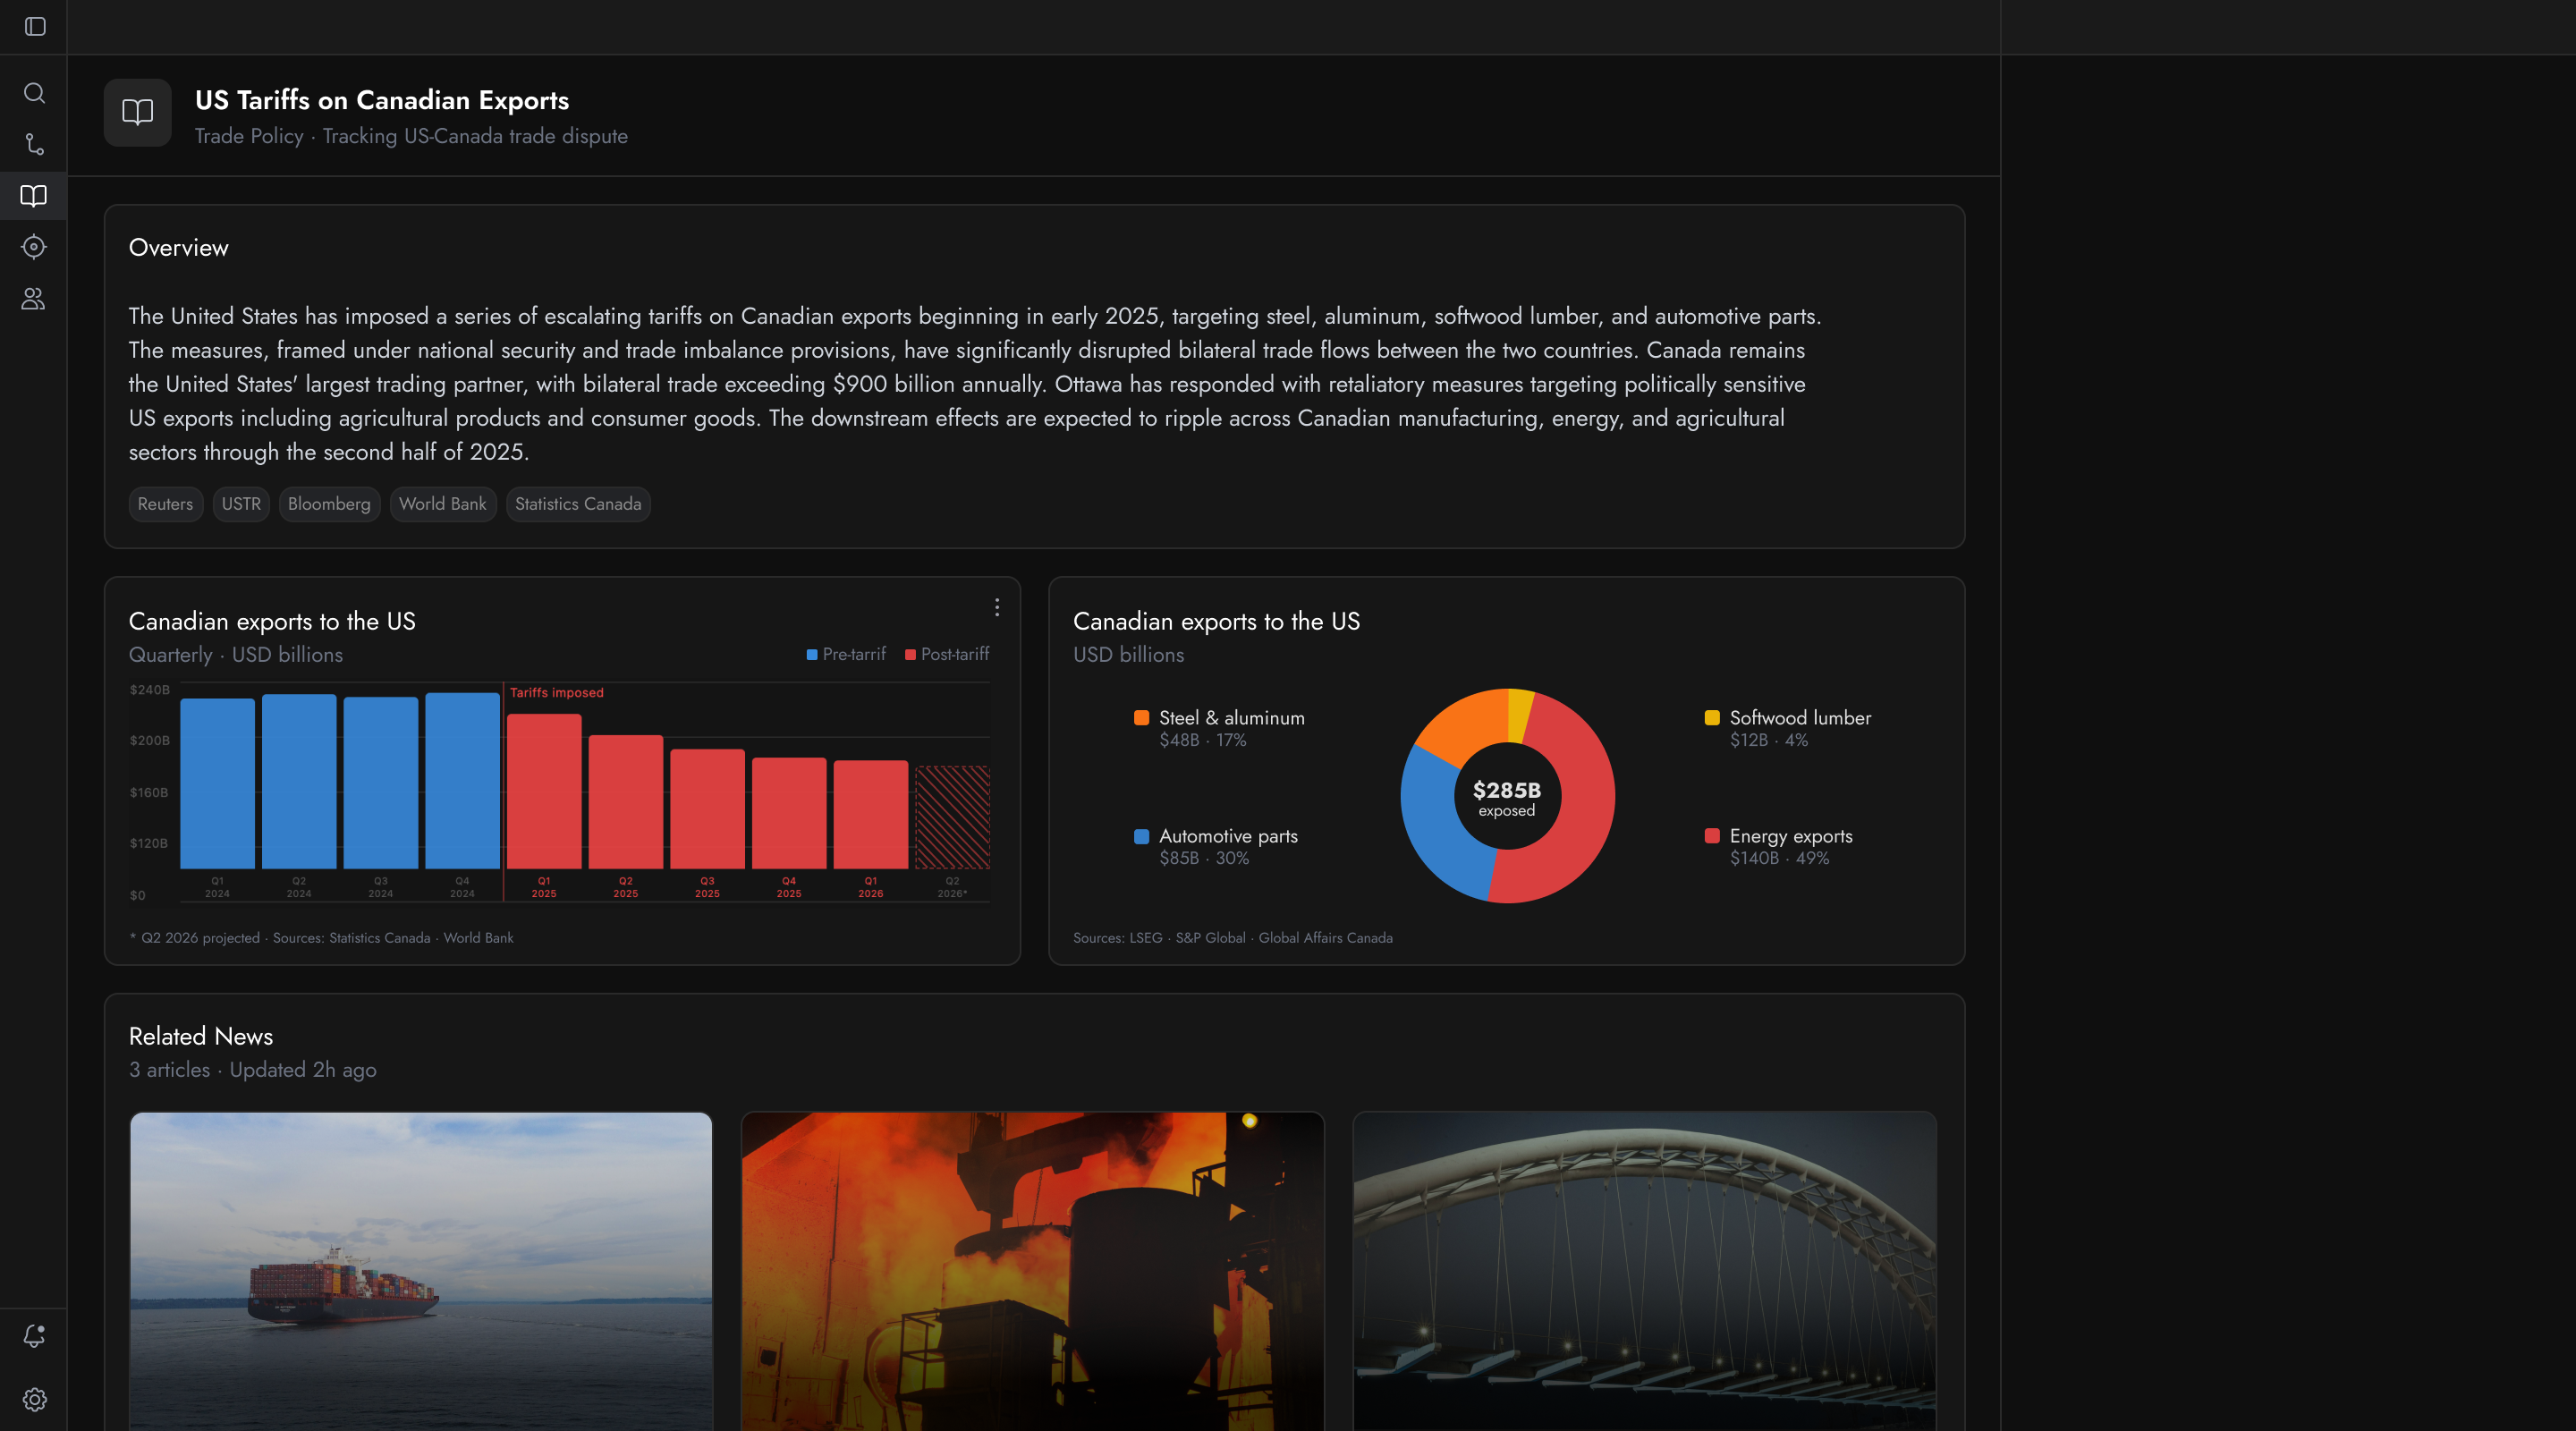


Master global complexity.


Stay ahead of the events that reshape your strategic environment.
Politics
Economics
Regulations
Markets
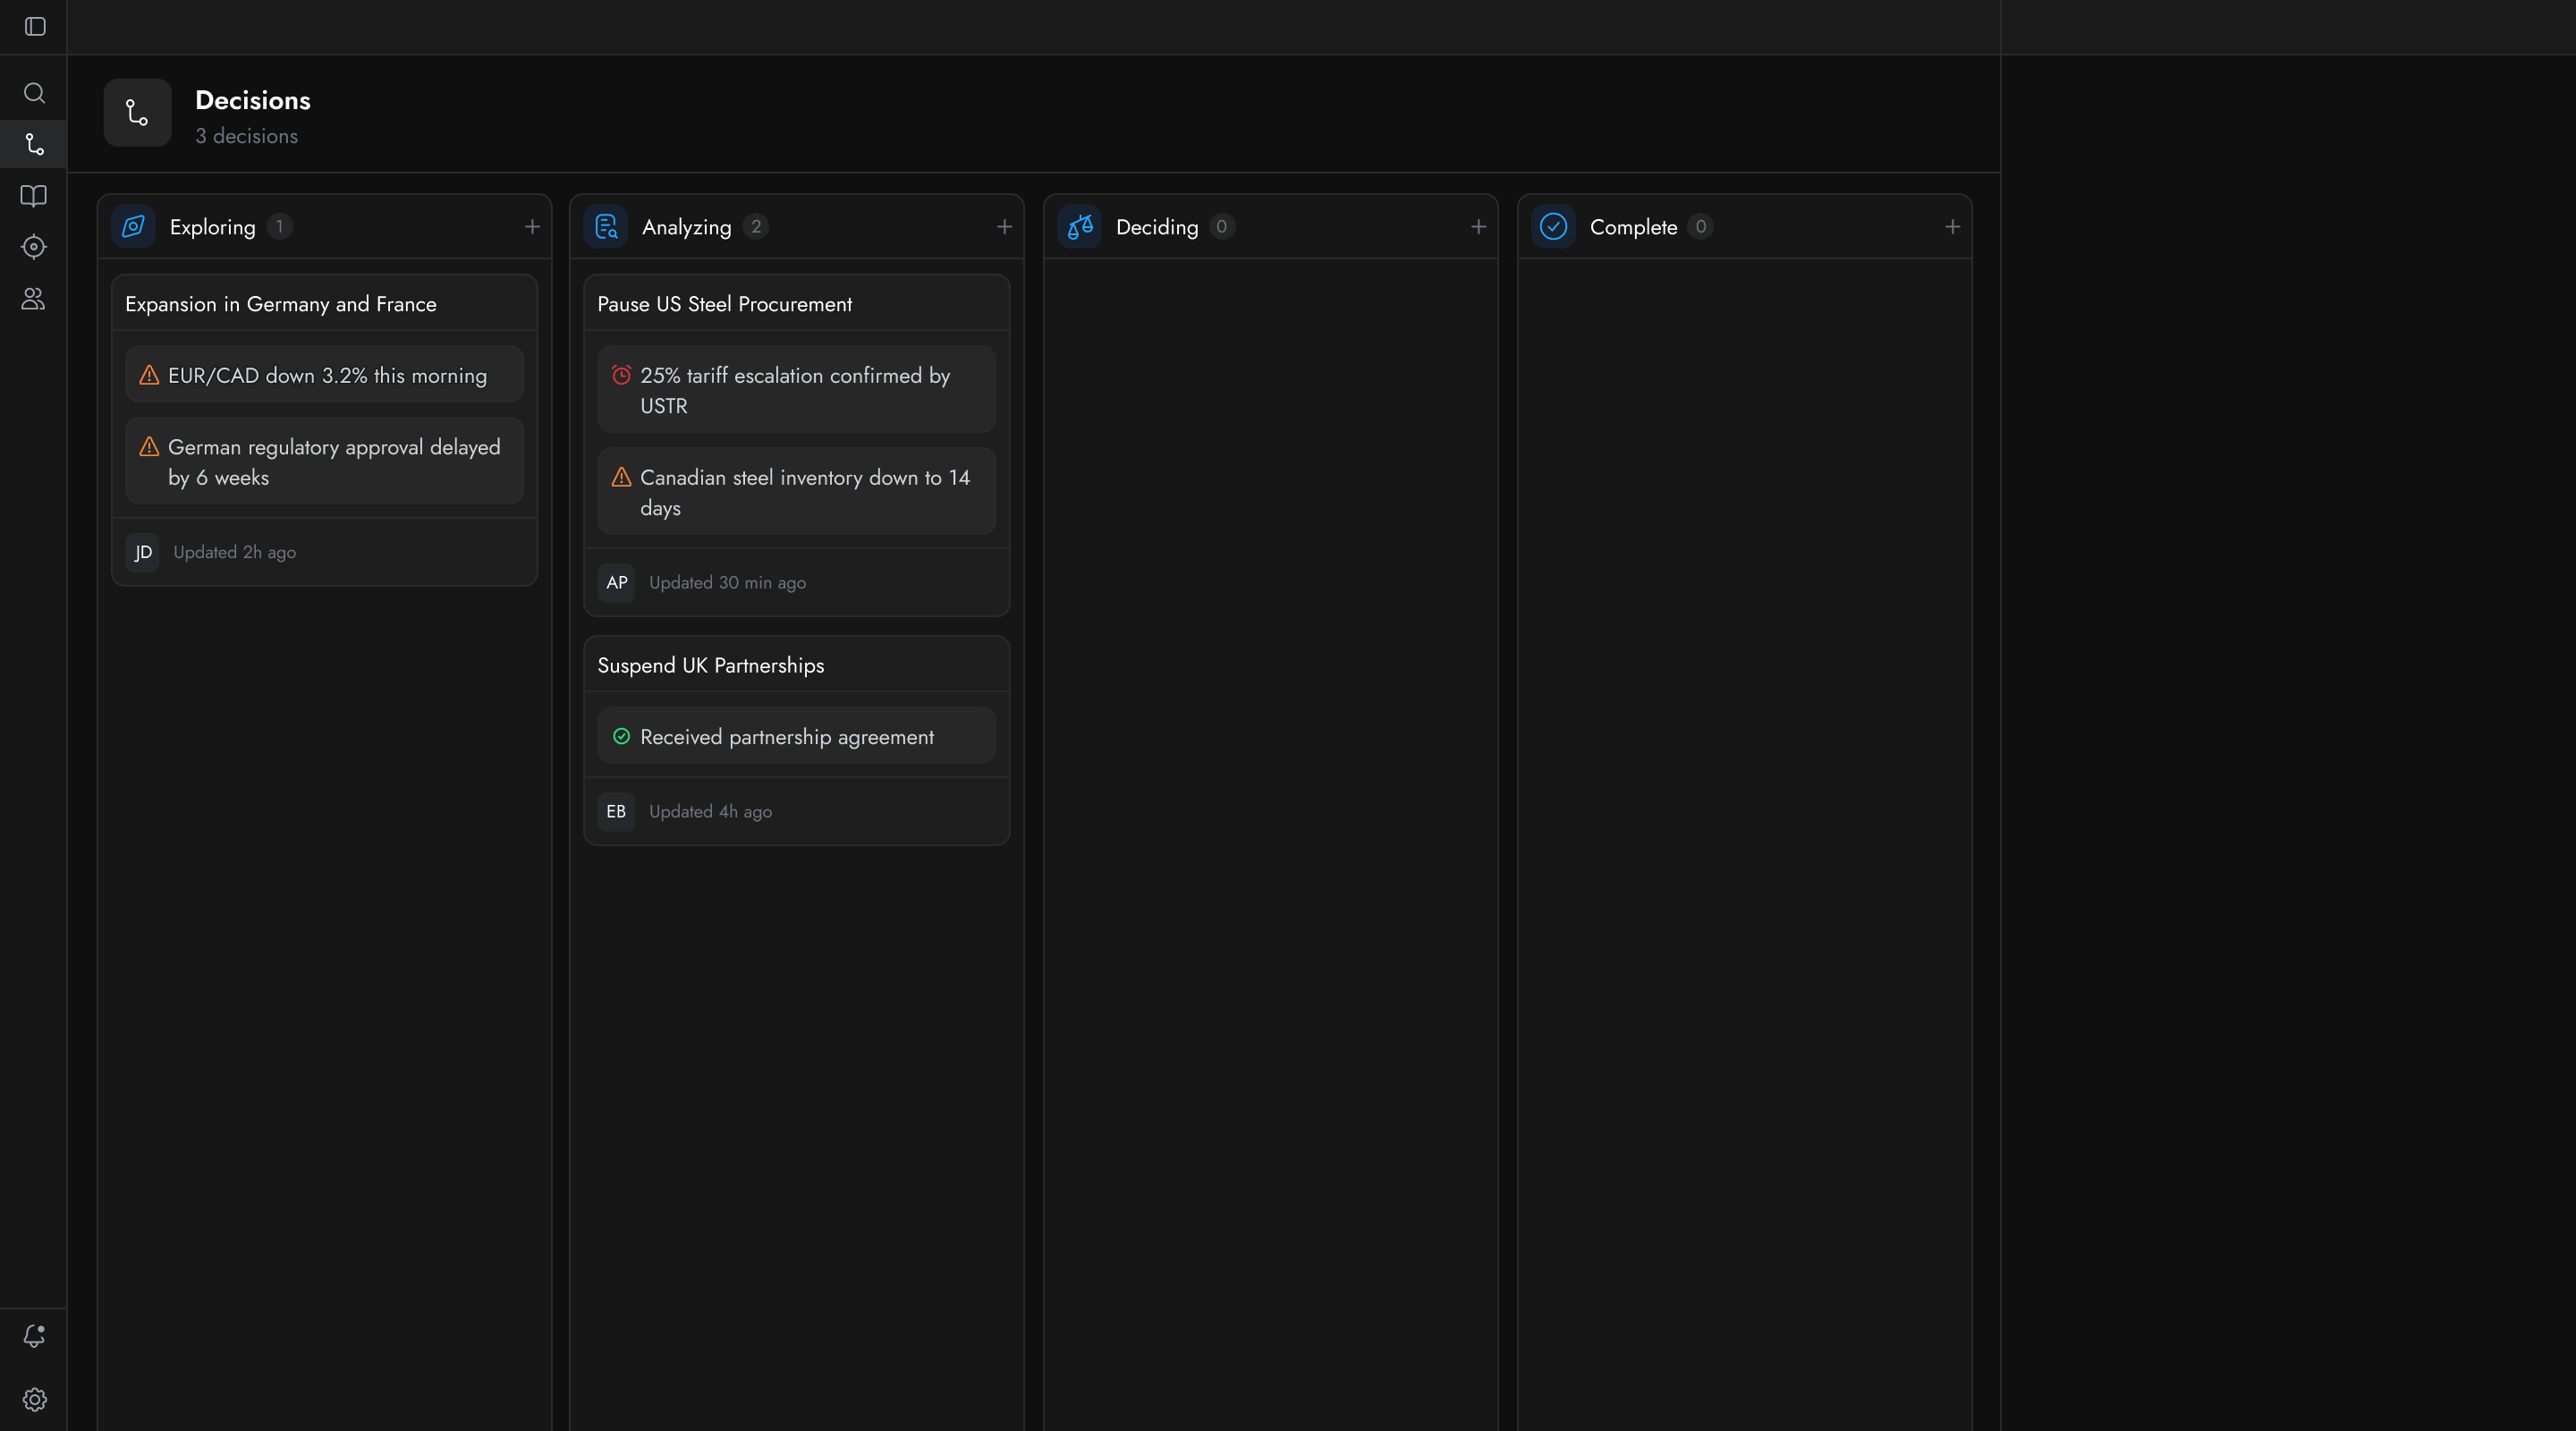
Know the moment a commitment needs to change.
Decision pipeline
Signal alerts
Team assignment
Audit trail
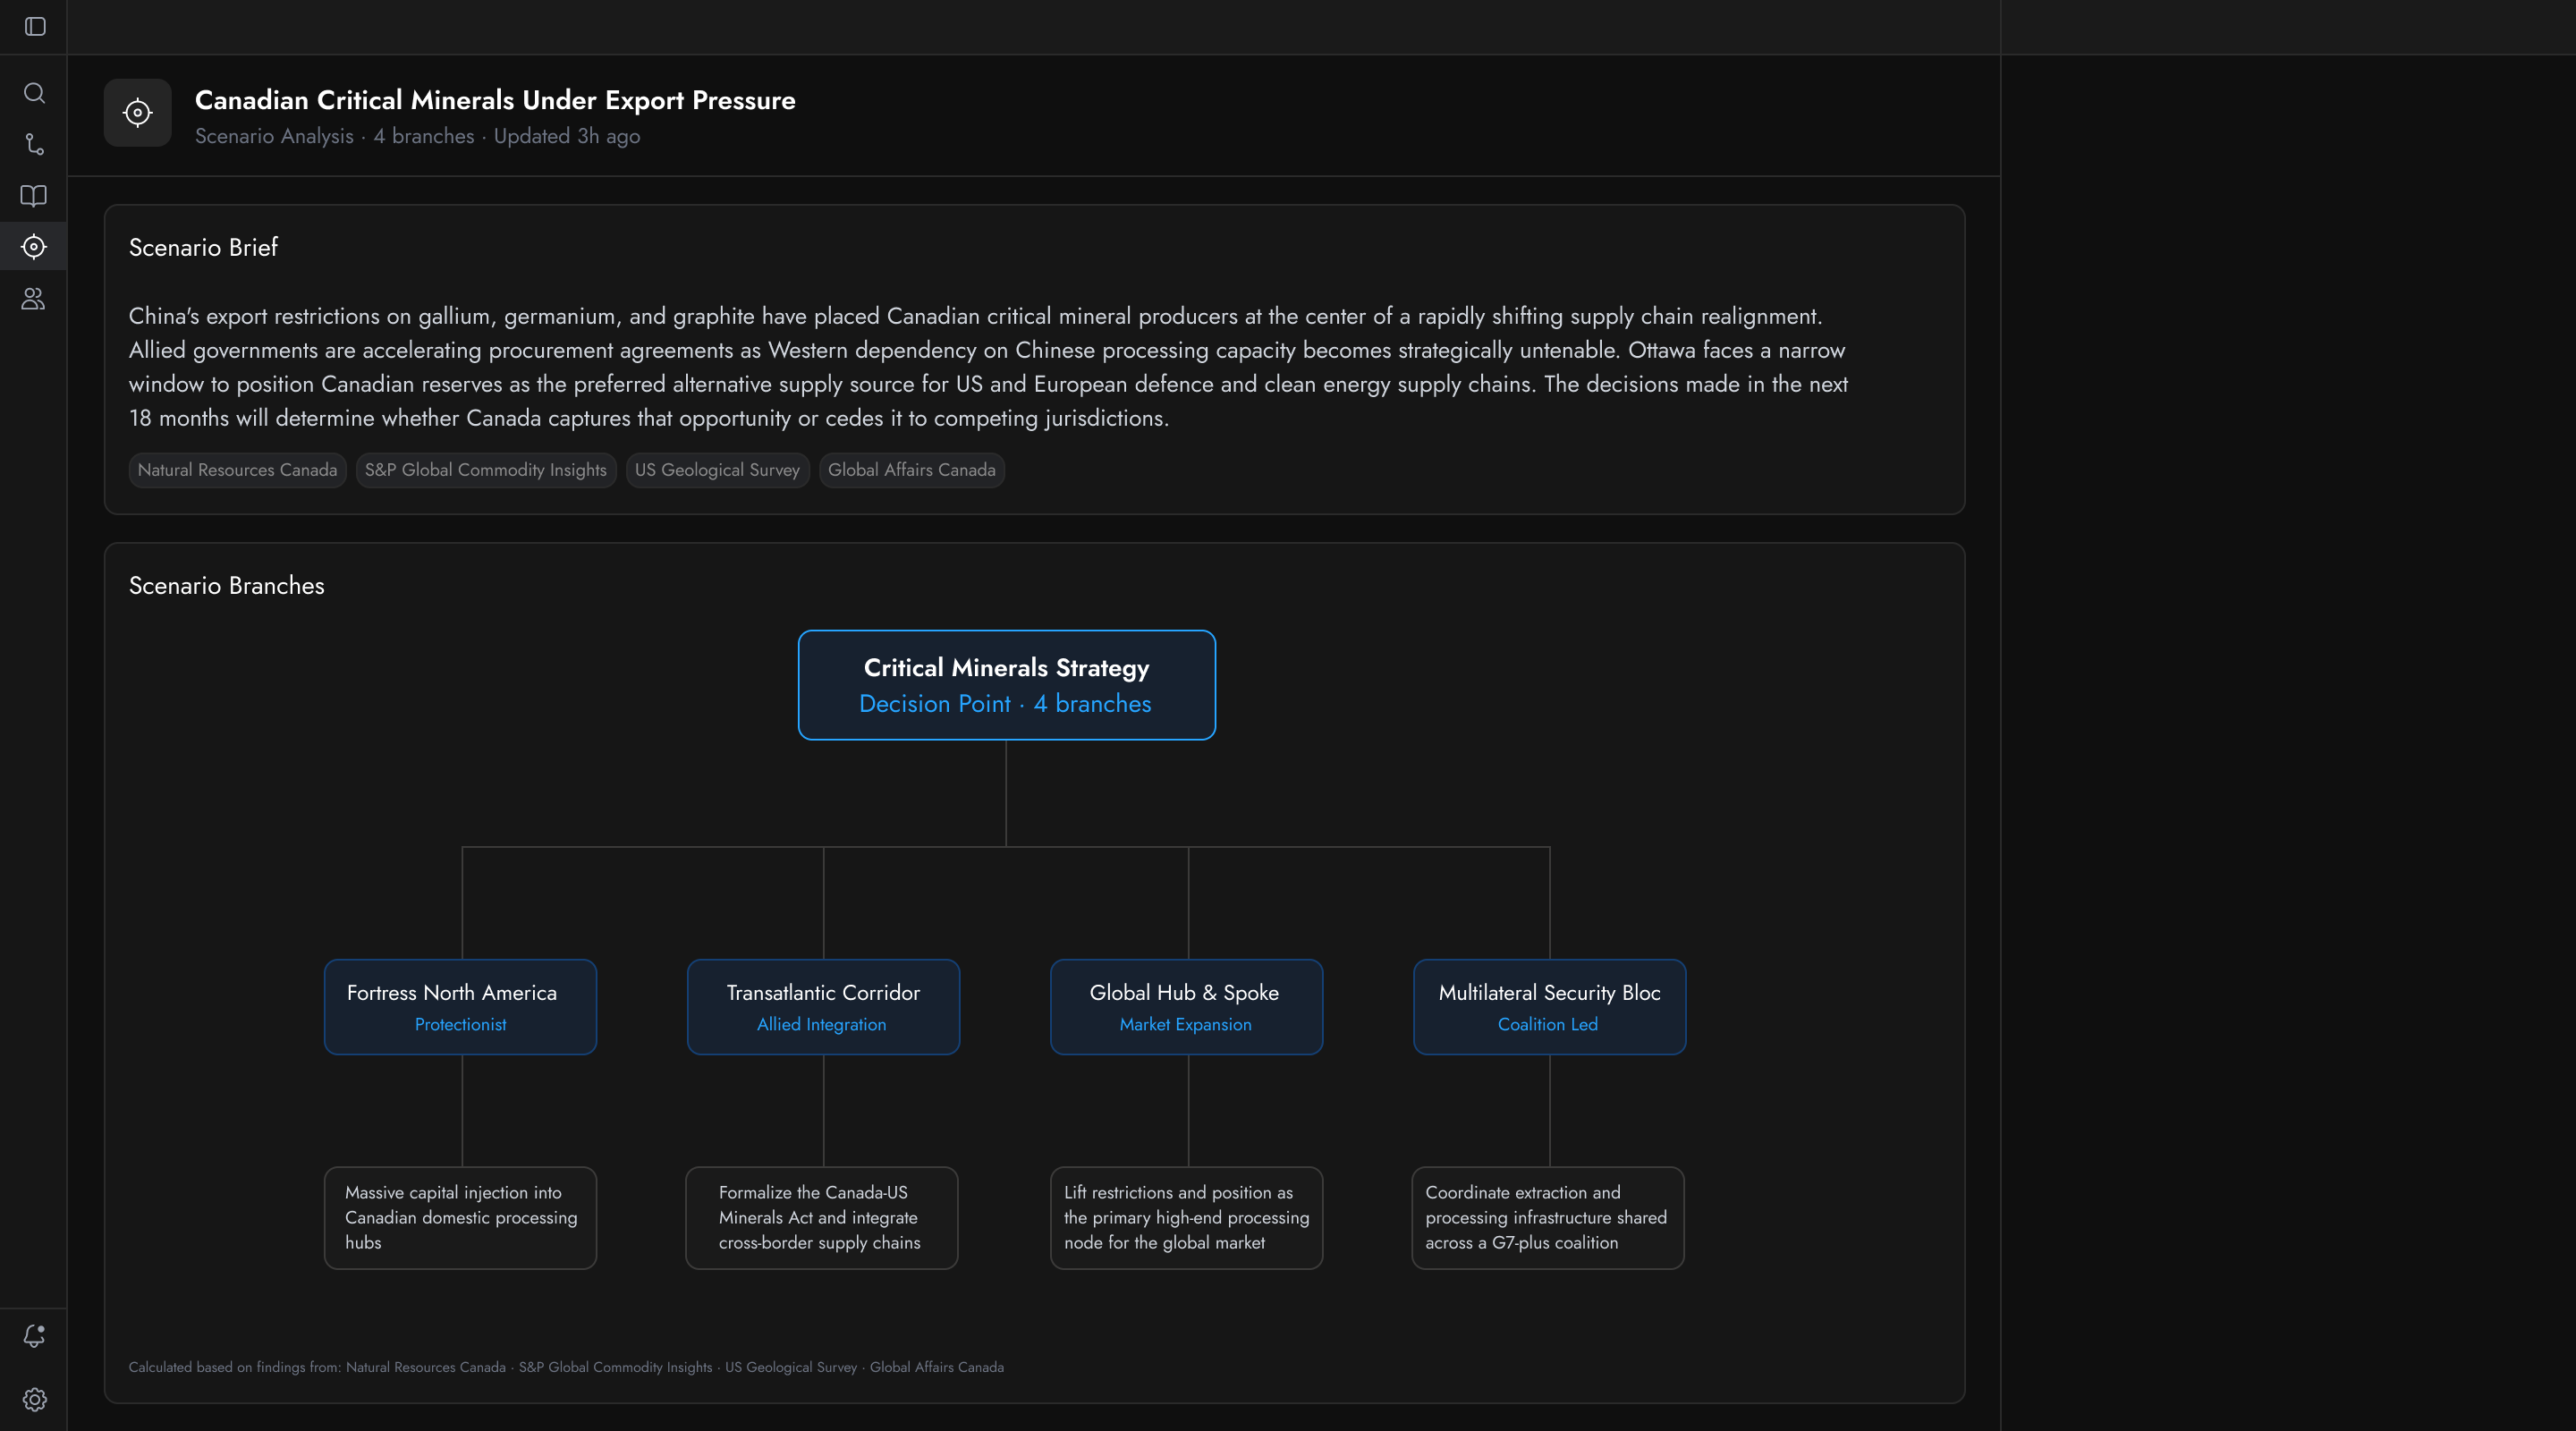
Model alternative futures to see where each decision leads.
Scenario branching
Outcome modeling
Risk scoring
Version history
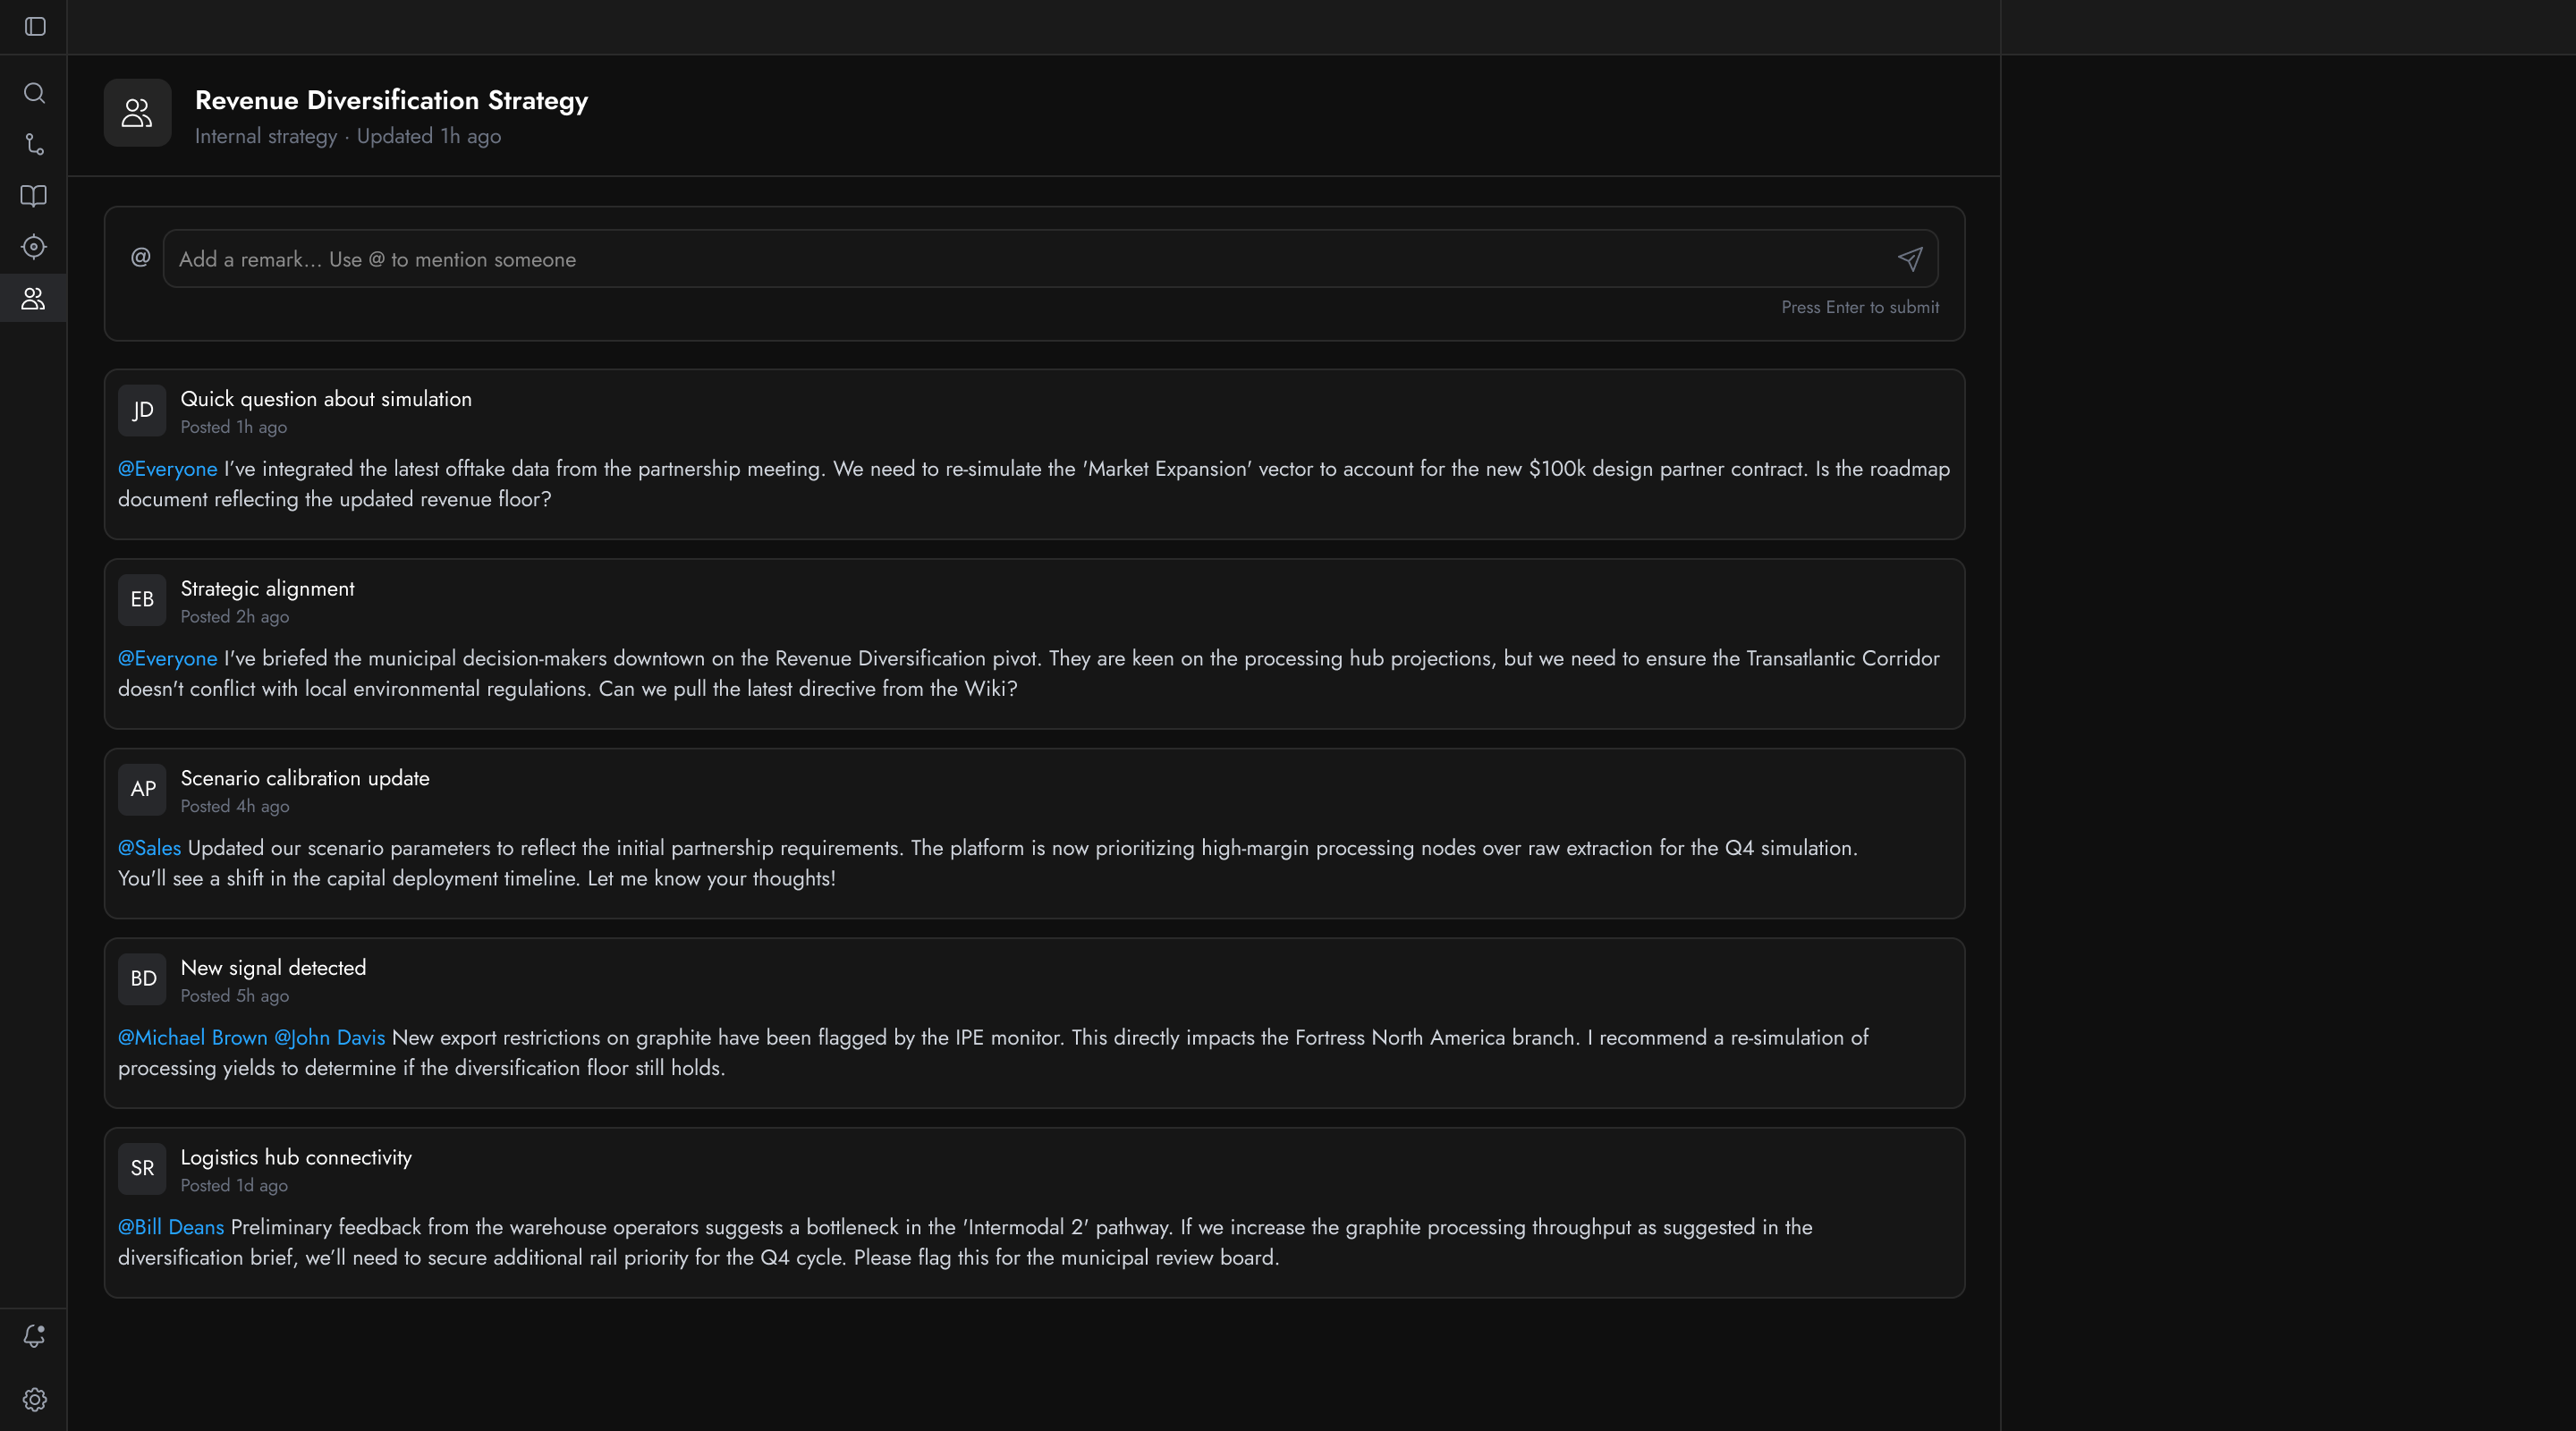
Share context as decisions are created, refined, and acted upon.
Shared workspaces
Contextual comments
Role-based access
Decision audit trail
01
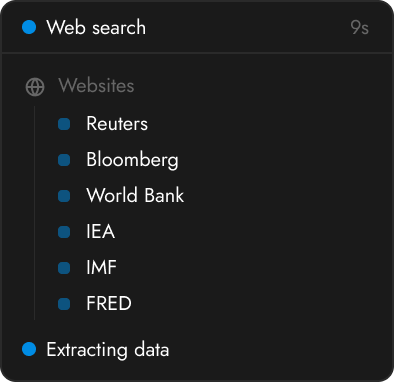
Eclipsis continuously ingests data across high-quality sources.
02
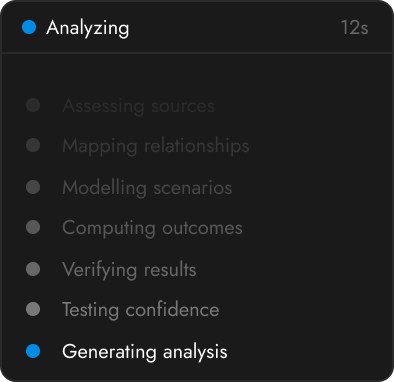
Agents find connections, weight scenarios, and surface what matters.
03
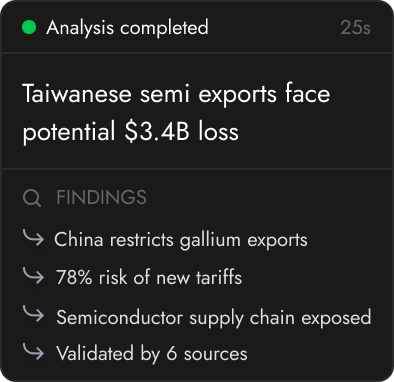
Act on clear insights with the full reasoning trail attached.
Explore